

Were there warning signs of a Japan Black Monday?
Why two equity risk models are better than one
Author
Olivier d’Assier,
Investment Decision Research, APAC
Using two different equity factor risk model variants can uncover hidden risk.
On 5 August, 2024, Japanese shares suffered a sharp fall on the back of the Bank of Japan’s decision to raise interest rates – for only the second time in 17 years – catching many investors off-guard. At the time of writing, the Nikkei is recovering after the worst crash since 1987. In this article, we take a closer look at the markets both in Japan and Asia ex-Japan to show how using the discrepancies between multiple risk models can help monitor this risk and better position portfolios.
The benefits of using multiple models
Using diverse models in risk management and portfolio construction, encompassing both fundamental and statistical approaches is a no brainer. These two methods are complementary rather than conflicting; they offer different but compatible perspectives on the mechanism that drive market returns. Statistical factor models are grounded in data, while fundamental risk models apply a fixed econometric framework with specific fundamental factors. For our risk models, we offer at a minimum two risk horizon options for each model: short-term (1-3 months) and medium-term (3-6 months).
Understanding the nature and magnitude of risk sources in your portfolio requires clarity. Discrepancies in risk assessments between the statistical and fundamental approaches, or between short-term and medium-term horizons, can offer valuable insights and serve as early indicators of potential risk shifts.
Building an early warning system
To leverage these insights, we created two risk gap charts. The first chart compares the risk predictions of the two horizon variants of our Japan equity fundamental risk model: short horizon versus medium horizon. The second chart examines the differences between the fundamental and statistical variants of our medium horizon Asia ex-Japan models. This note explores how analyzing these differences can help create an early warning system for emerging risk events.
The chart below compares the predicted risk for the STOXX Japan Index using both variants of the fundamental Japanese risk models: the medium horizon and the short horizon models. The black line represents the risk forecast from the medium horizon model. The shaded areas above and below this line illustrate the risk differential from the short horizon model. Green areas indicate a lower risk forecast by the short horizon model compared to the medium horizon model, suggesting that risk is trending down in the near term. Conversely, red areas indicate a higher risk forecast by the short horizon model, implying risk is trending up. The blue line on the chart shows the cumulative return of the STOXX Japan index over the past twelve months.
Figure 1: STOXX Japan 600 (Medium Horizon vs Short Horizon)
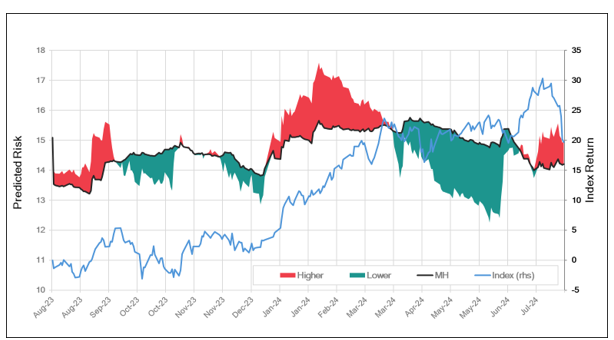 Source: Axioma Japan Equity Factor Risk Model, STOXX Japan 600 Index
When fundamental and statistical factor risk models don’t agree
Over the last twelve months, there have been several periods when our two horizon variants of the fundamental risk model for Japan disagreed on the predicted level of risk for the index. At times, this disagreement exceeded 100 basis points. This divergence is not about one model being right and the other wrong; rather, it signals to the portfolio manager that risk may be changing direction soon or challenging to estimate at the moment, warranting additional human judgment in risk management.
When the shaded area is red, it indicates that risk might be trending up soon, while a green shaded area suggests that the risk could be trending down. This information aids managers in their risk budgeting, especially when they have a firm risk constraint in their mandate. A red shaded area can alert the portfolio manager that the portfolio's risk may soon exceed the constraint, prompting more caution and some de-risking ahead of time.
Examining the chart above, both risk model variants agreed that risk was decreasing in June 2024. However, starting in July, the short horizon variant detected a change in the direction of risk and indicated that it may soon turn up – an additional source of risk in the daily market data that the fundamental variant did not identify. Throughout July, the medium horizon variant's predicted risk remained mostly flat, whereas the short horizon model indicated an uptrend in risk, creating a significant (>100 bps) risk premium gap (red) in the chart. This served as a warning for the increased volatility observed during the first ten trading days of August.
The chart below shows the predicted risk of the STOXX Asia/Pacific 600 ex Japan Index using the medium horizon variants of both our fundamental and statistical Asia Pacific ex-Japan model. The black line represents the risk forecast from the fundamental model for the index. The shaded areas indicate the risk discount (green) or risk premium (red) from the statistical factor model. When the shaded area is green, it means the statistical factor model predicts lower risk than the fundamental risk model, suggesting the statistical model has identified greater market diversification than its fundamental peer. Conversely, a red shaded area signifies that the statistical factor model predicts higher risk than the fundamental model, potentially indicating an additional hidden/transient source of risk not captured by the predefined factors in the fundamental risk model.
Figure 2: STOXX Asia/Pacific 600 ex Japan Index (Fundamental vs Statistical)
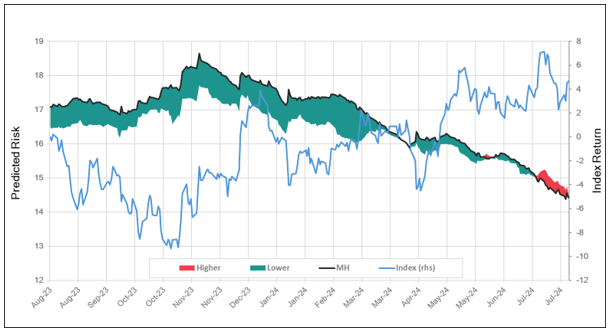 Source: Axioma Asia-Pacific ex-Japan Equity Factor Risk Model, STOXX Asia/Pacific 600 ex Japan Index
In this chart, we observe that the statistical variant has been predicting slightly lower risk (about 50 basis points less) than the fundamental variant for eleven of the last twelve months. However, this trend changed in July of this year, when the statistical variant indicated that it has detected additional risk sources not captured by the fixed factors in the fundamental risk model (the shaded area turns red from green). Knowing how volatility behaved in the first week of August, this can be seen as an early warning sign that hidden risks were in play, signaling to the portfolio manager that market volatility might soon rise.
Indispensable tools for risk analytics
The risk gap chart is just one of the indicators the Investment Decision team monitors in its early warning dashboards. It is valuable for confirming or contradicting other metrics we closely follow, such as investor sentiment (ROOF Scores), changes in pairwise correlations, market diversification or concentration and more. Having multiple perspectives on risk can also be highly beneficial for portfolio managers who use the flexibility within Axioma Risk, a multi-asset risk management software system. Remember, predicted risk (ex-ante risk) is merely an estimate, and using multiple estimates to triangulate the 'true' risk is advantageous. Don’t waste it.
The risk gap is one of ten metrics used in the computation of ROOF Scores, our investor sentiment indicator. To get weekly ROOF Scores and other risk monitors delivered directly your inbox, register here.
“Discrepancies in risk assessments between the statistical and fundamental approaches, or between short-term and medium-term horizons, can offer valuable insights and serve as early indicators of potential risk shifts.”