

Stress testing the US election
Authors:
Olivier d’Assier, Investment Decision Research
Christoph Schon, Investment Decision Research
Seeking ‘Election Alpha’? Turn expected losses into potential gains.
The US presidential election is fast approaching, and it’s shaping up to be a tight race. At the time of writing, Vice President Kamala Harris and former President Donald Trump are neck and neck in the polls, making it too close to call. Investors need to prepare for three potential outcomes:
- A “Blue Wave” (Harris wins and Democrats control Congress)
- A “Red Wave” (Trump wins and Republicans control Congress)
- A “Divided” government (either Harris or Trump wins, but the opposing party controls Congress)
Stress test overview
To help investors prepare, we propose a workflow using the Axioma suite of products. This involves configuring a stress test in Axioma Risk based on each candidate’s fiscal policy impact on the US yield curve. The expected losses or gains at the constituent level are then used as alpha inputs in the Axioma Portfolio Optimizer to create target “Harris,” “Trump,” and “Divided” active portfolios from the S&P500 Index. Additionally, we create a probability-weighted “Blend” portfolio of the three outcomes, assigning a 45% probability to both the Blue and Red wave scenarios and a 10% probability to the Divided scenario. We compare these portfolios to our existing active portfolio and track their daily performance using the Axioma Performance Analytics tool to gauge investor sentiment towards each scenario.
The goal is to create multiple possible futures to support investors’ decision-making processes. For instance, an investor with a “Current” active portfolio who anticipates a Blue wave on November 5th might want to rebalance their portfolio using a dual benchmark optimization. This would involve tracking both their S&P500 benchmark and the “Harris” optimal solution to ensure alignment with their current alphas and constraints while capturing as much ‘election alpha’ as possible from their political forecast.
Setting up the three stress test scenarios
For the third election in a row, there is a stark contrast between the platform of the two leading candidates, and nowhere more so than in their fiscal policy. Using the Penn Wharton Budget Model projecting the policy proposals’ fiscal, distributional, and economic effects, Christoph Schon1, mapped each candidates fiscal policy impact to forecasted changes in the US yield curve, shocking both the USTB 2-Year and USTB 10-Year yields up or down.
Figure 1 illustrates the anticipated shifts in the US Treasury yield curve under the Harris plan. In our ‘Harris’ stress test, we will adjust the USTB 2-Year yield downward by 25 basis points and increase the USTB 10-Year yield by 60 basis points: “The Federal Reserve will continue to ease monetary conditions in line with market expectations, and the short end of the yield curve will adjust accordingly. But long Treasury yields will still go up in anticipation of higher fiscal spending, especially on social programs and green energy. The curve remains mildly inverted in the near term, reflecting slower growth expectations than under a low-tax/low-regulation Trump administration.”
Figure 1: Forecasted impact on US Treasury Yield Curve from the Harris/Democrat fiscal policies
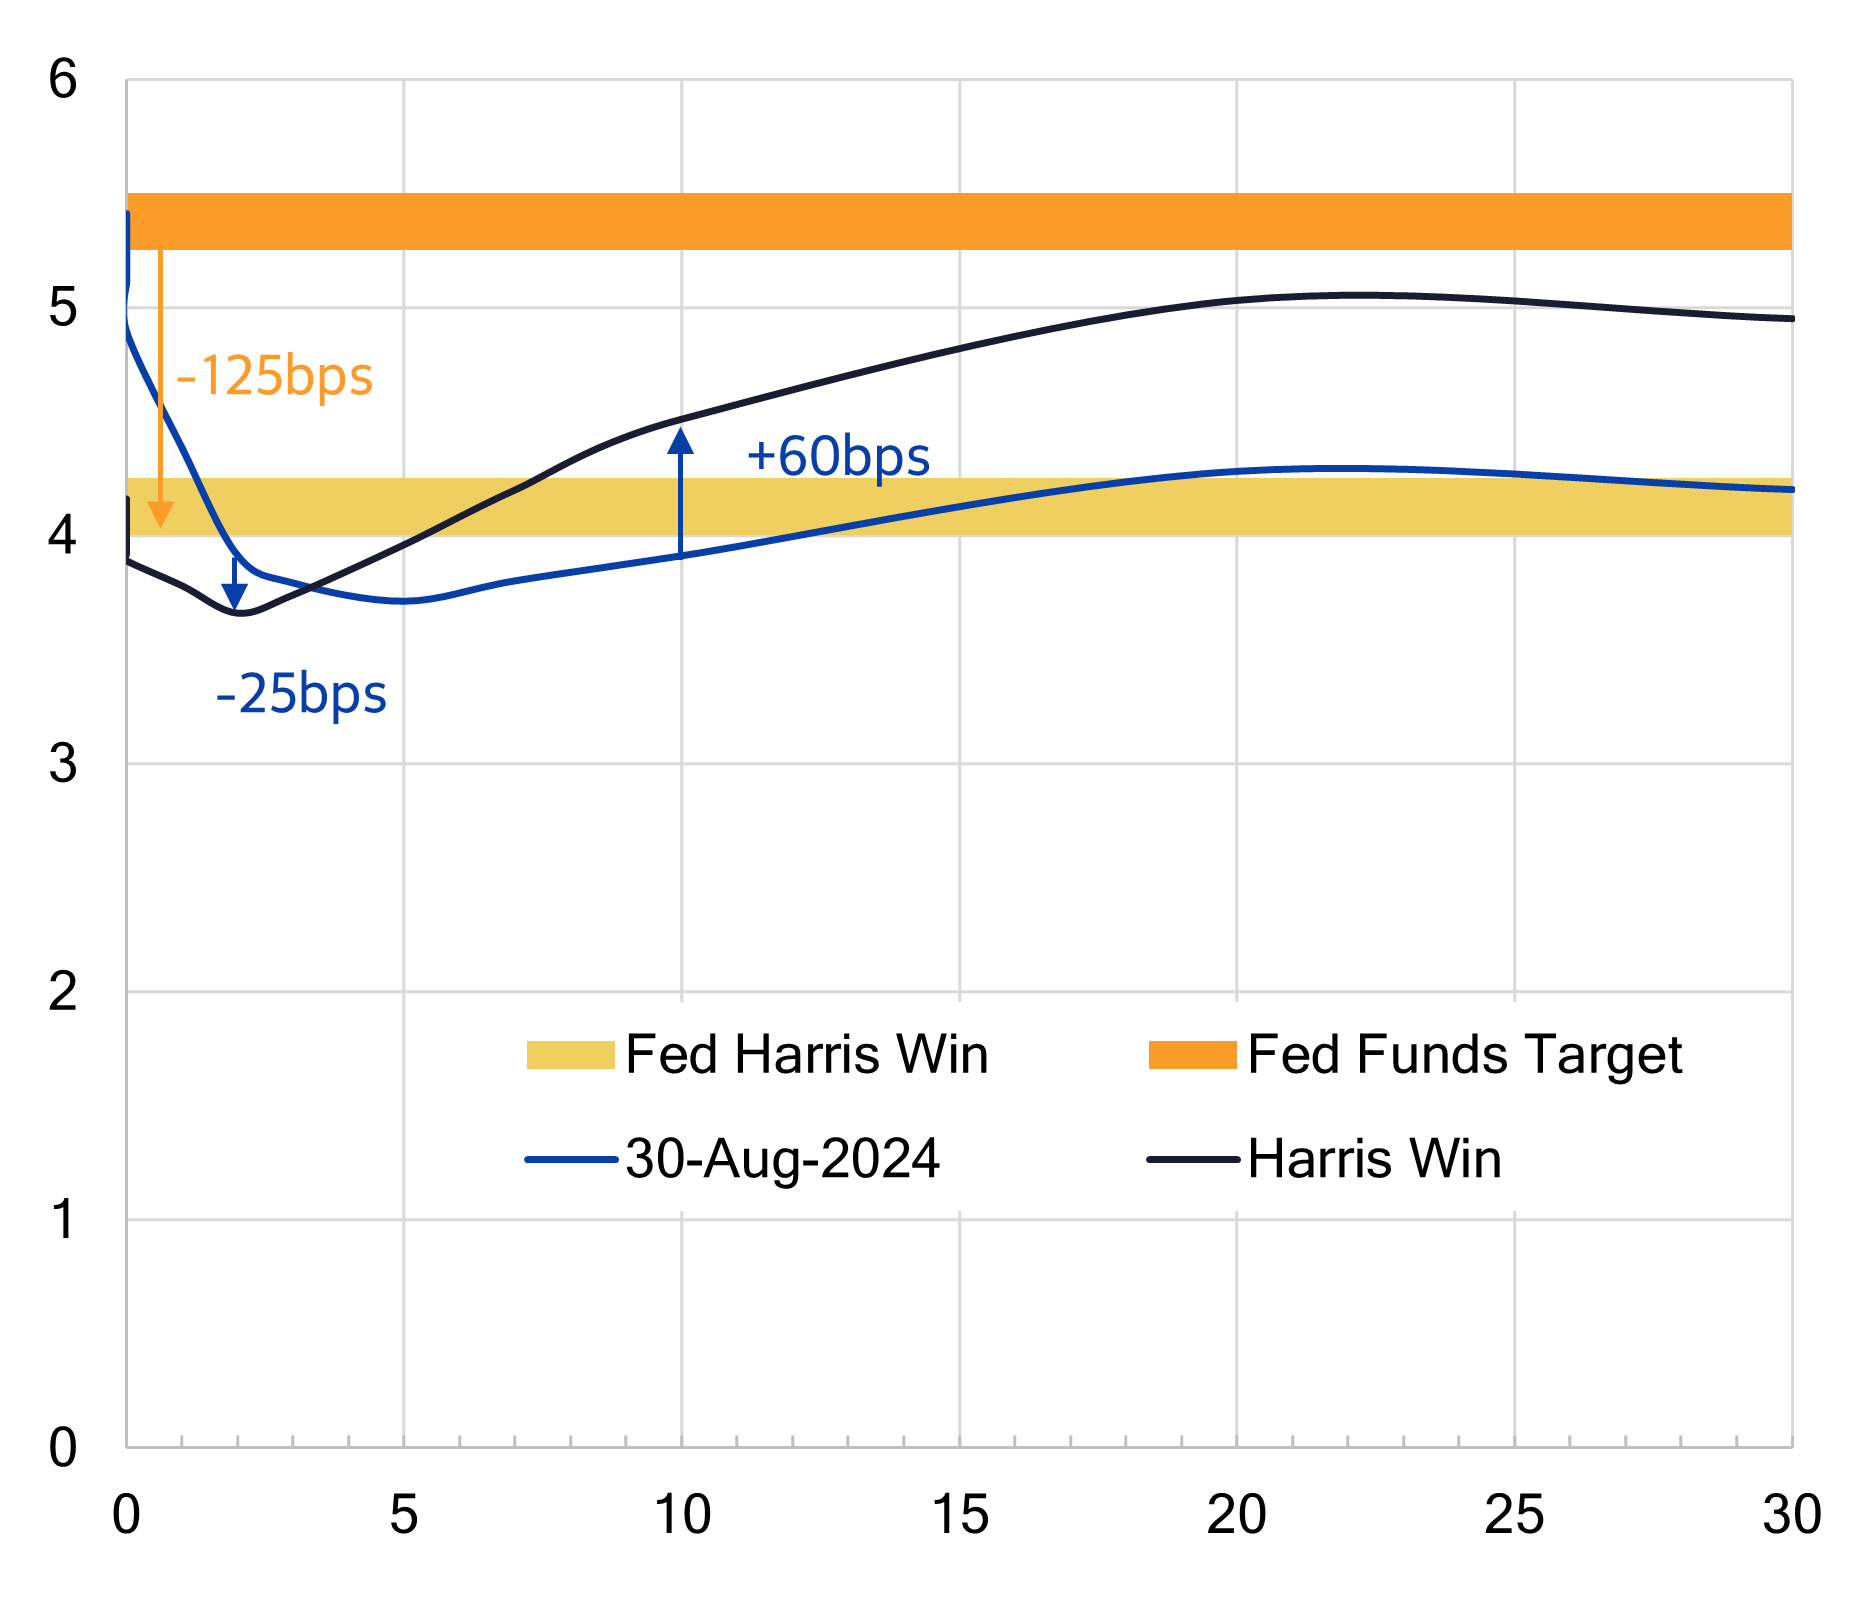
Source: Multi-Asset Class Risk Monitor Insights, Christoph Schon, September 12, 2024
Figure 2 illustrates the anticipated shifts in the US Treasury yield curve under the Trump plan. In our ‘Trump’ stress test, we will adjust the USTB 2-Year yield upward by 95 basis points and increase the USTB 10-Year yield by 115 basis points: “A Trump administration is likely to focus on deregulation and tax cuts, which are aimed at stimulating economic growth and stock market gains but might also increase the federal budget deficit and inflationary pressures. The Federal Reserve will cut rates one more time at its November 7 meeting to assert its independence, but then leaves its policy rate target at 4.75-5.00% for the foreseeable future. Short-term Treasury yields adapt by rising above that rate. Long-term inflation expectations could resurge to 2.5% and push the 10-year US Treasury yield above 5%. The yield curve would steepen and become upward sloping again as a result.”
Figure 2: Forecasted impact on US Treasury Yield Curve from the Trump/Republican fiscal policies
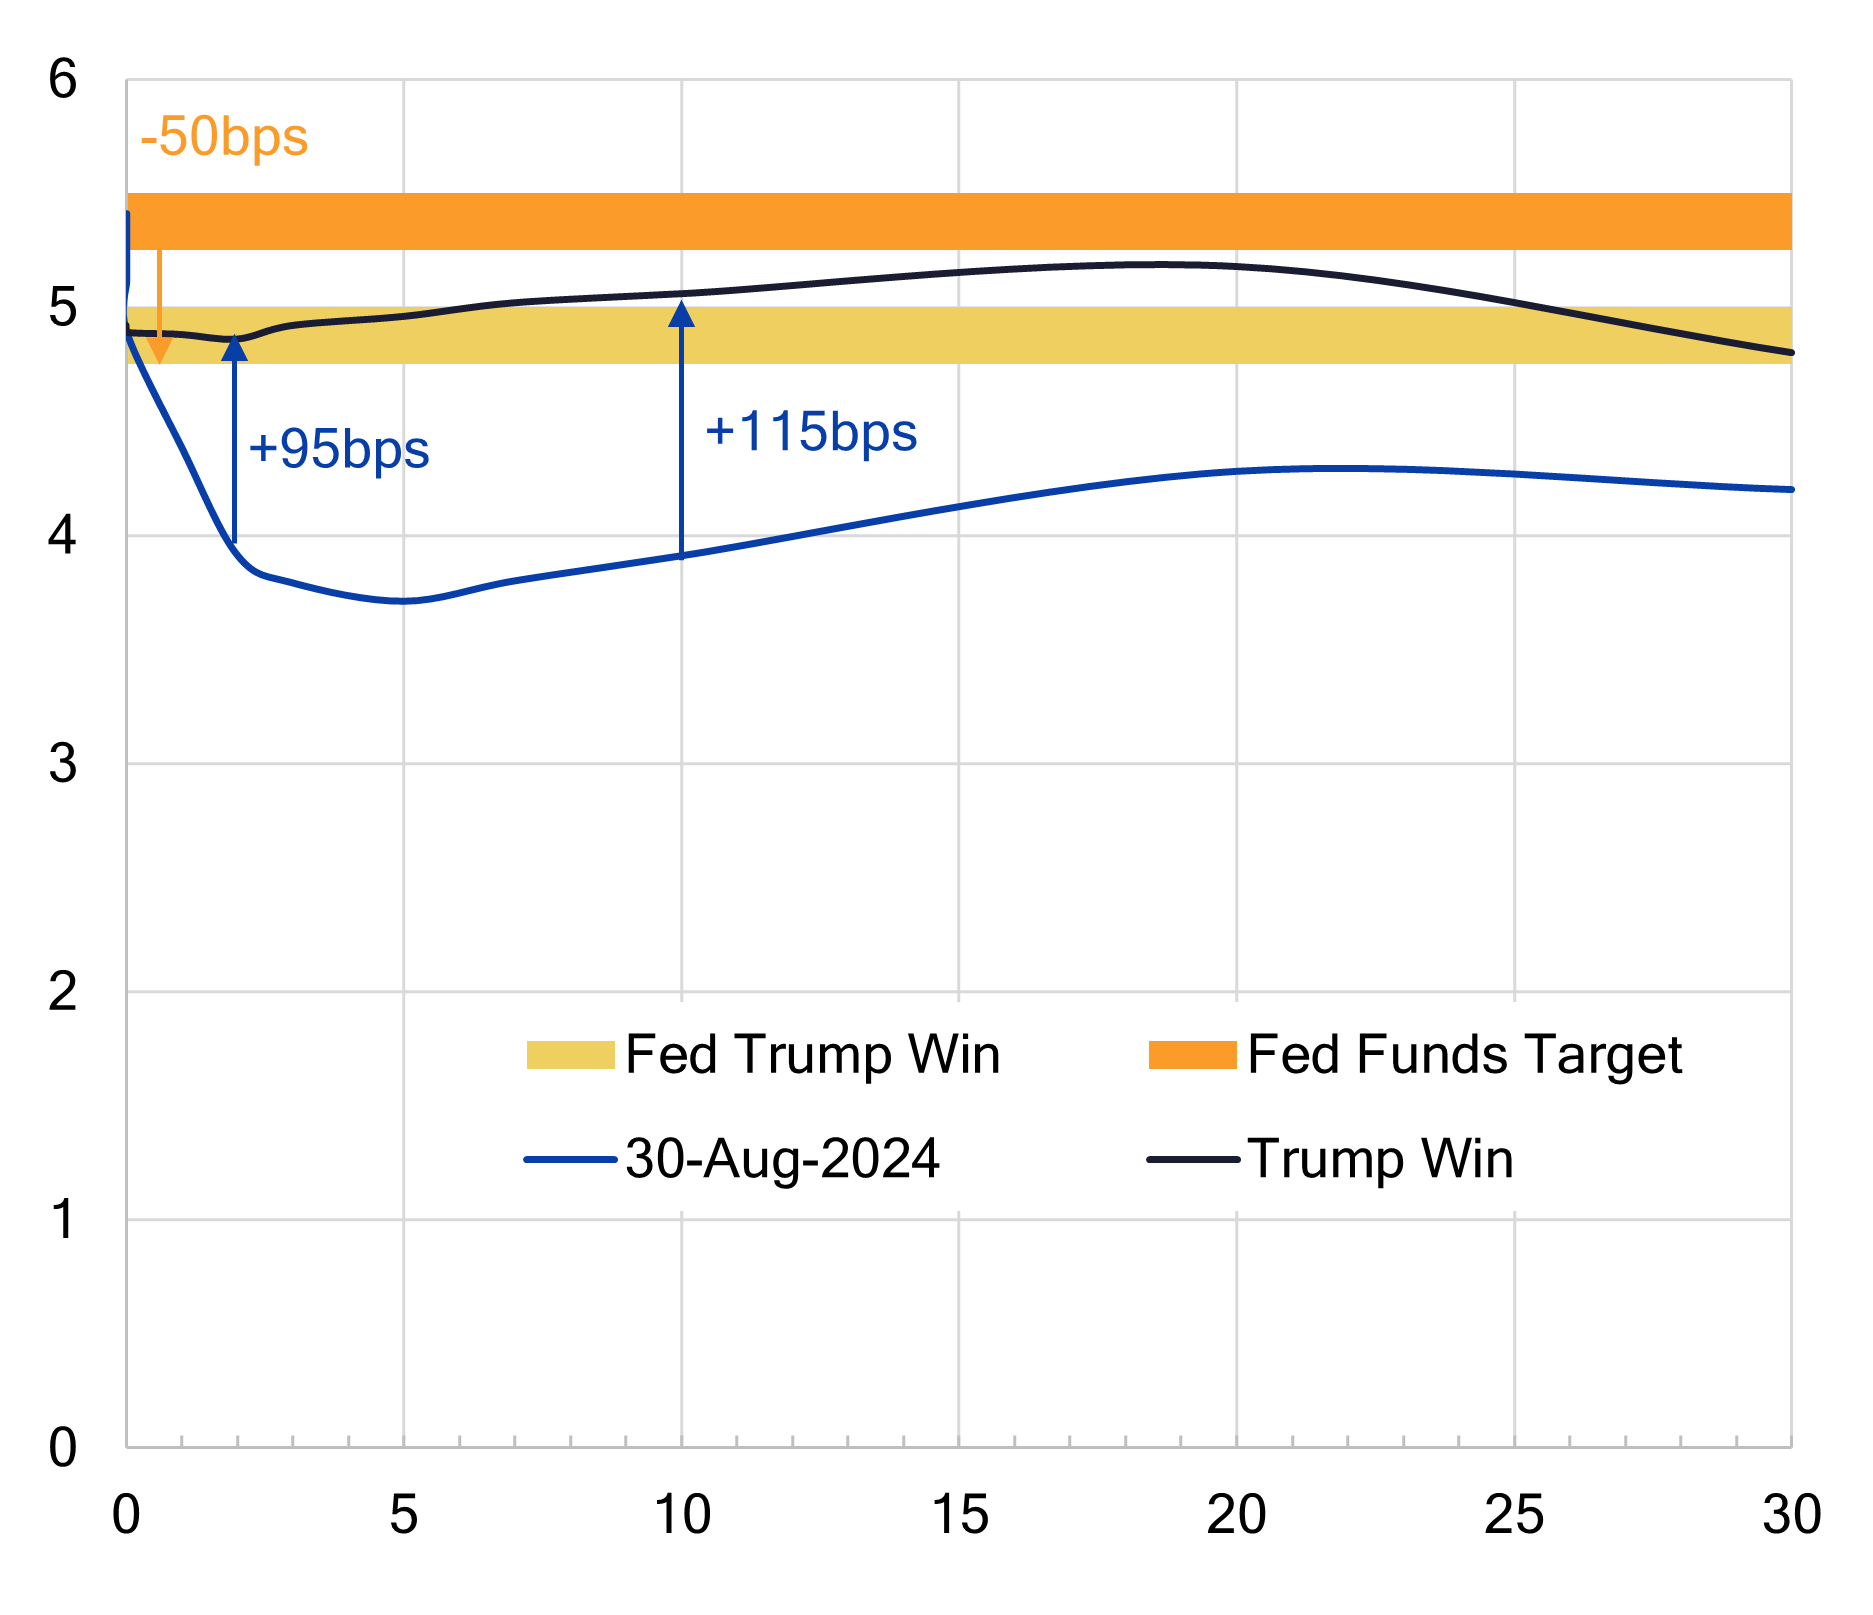
Source: Multi-Asset Class Risk Monitor Insights, Christoph Schon, September 12, 2024
Figure 3 illustrates the anticipated shifts in the US Treasury yield curve under the Divided Government scenario. In our ‘Divided’ stress test, we will adjust the USTB 2-Year yield downward by 50 basis points and lower the USTB 10-Year yield by 100 basis points: “The current suspension of the debt ceiling will expire on Jan. 1, 2025. A Republican Congress is likely to cause trouble for a Harris White House (and vice-versa). Flight to safety will push down Treasury yield across all maturities and result in a negative stock-bond correlation. The Federal Reserve will cut more aggressively than currently expected to stabilize and reassure markets.”
Figure 3: Forecasted impact on US Treasury Yield Curve from the Divided Government scenario
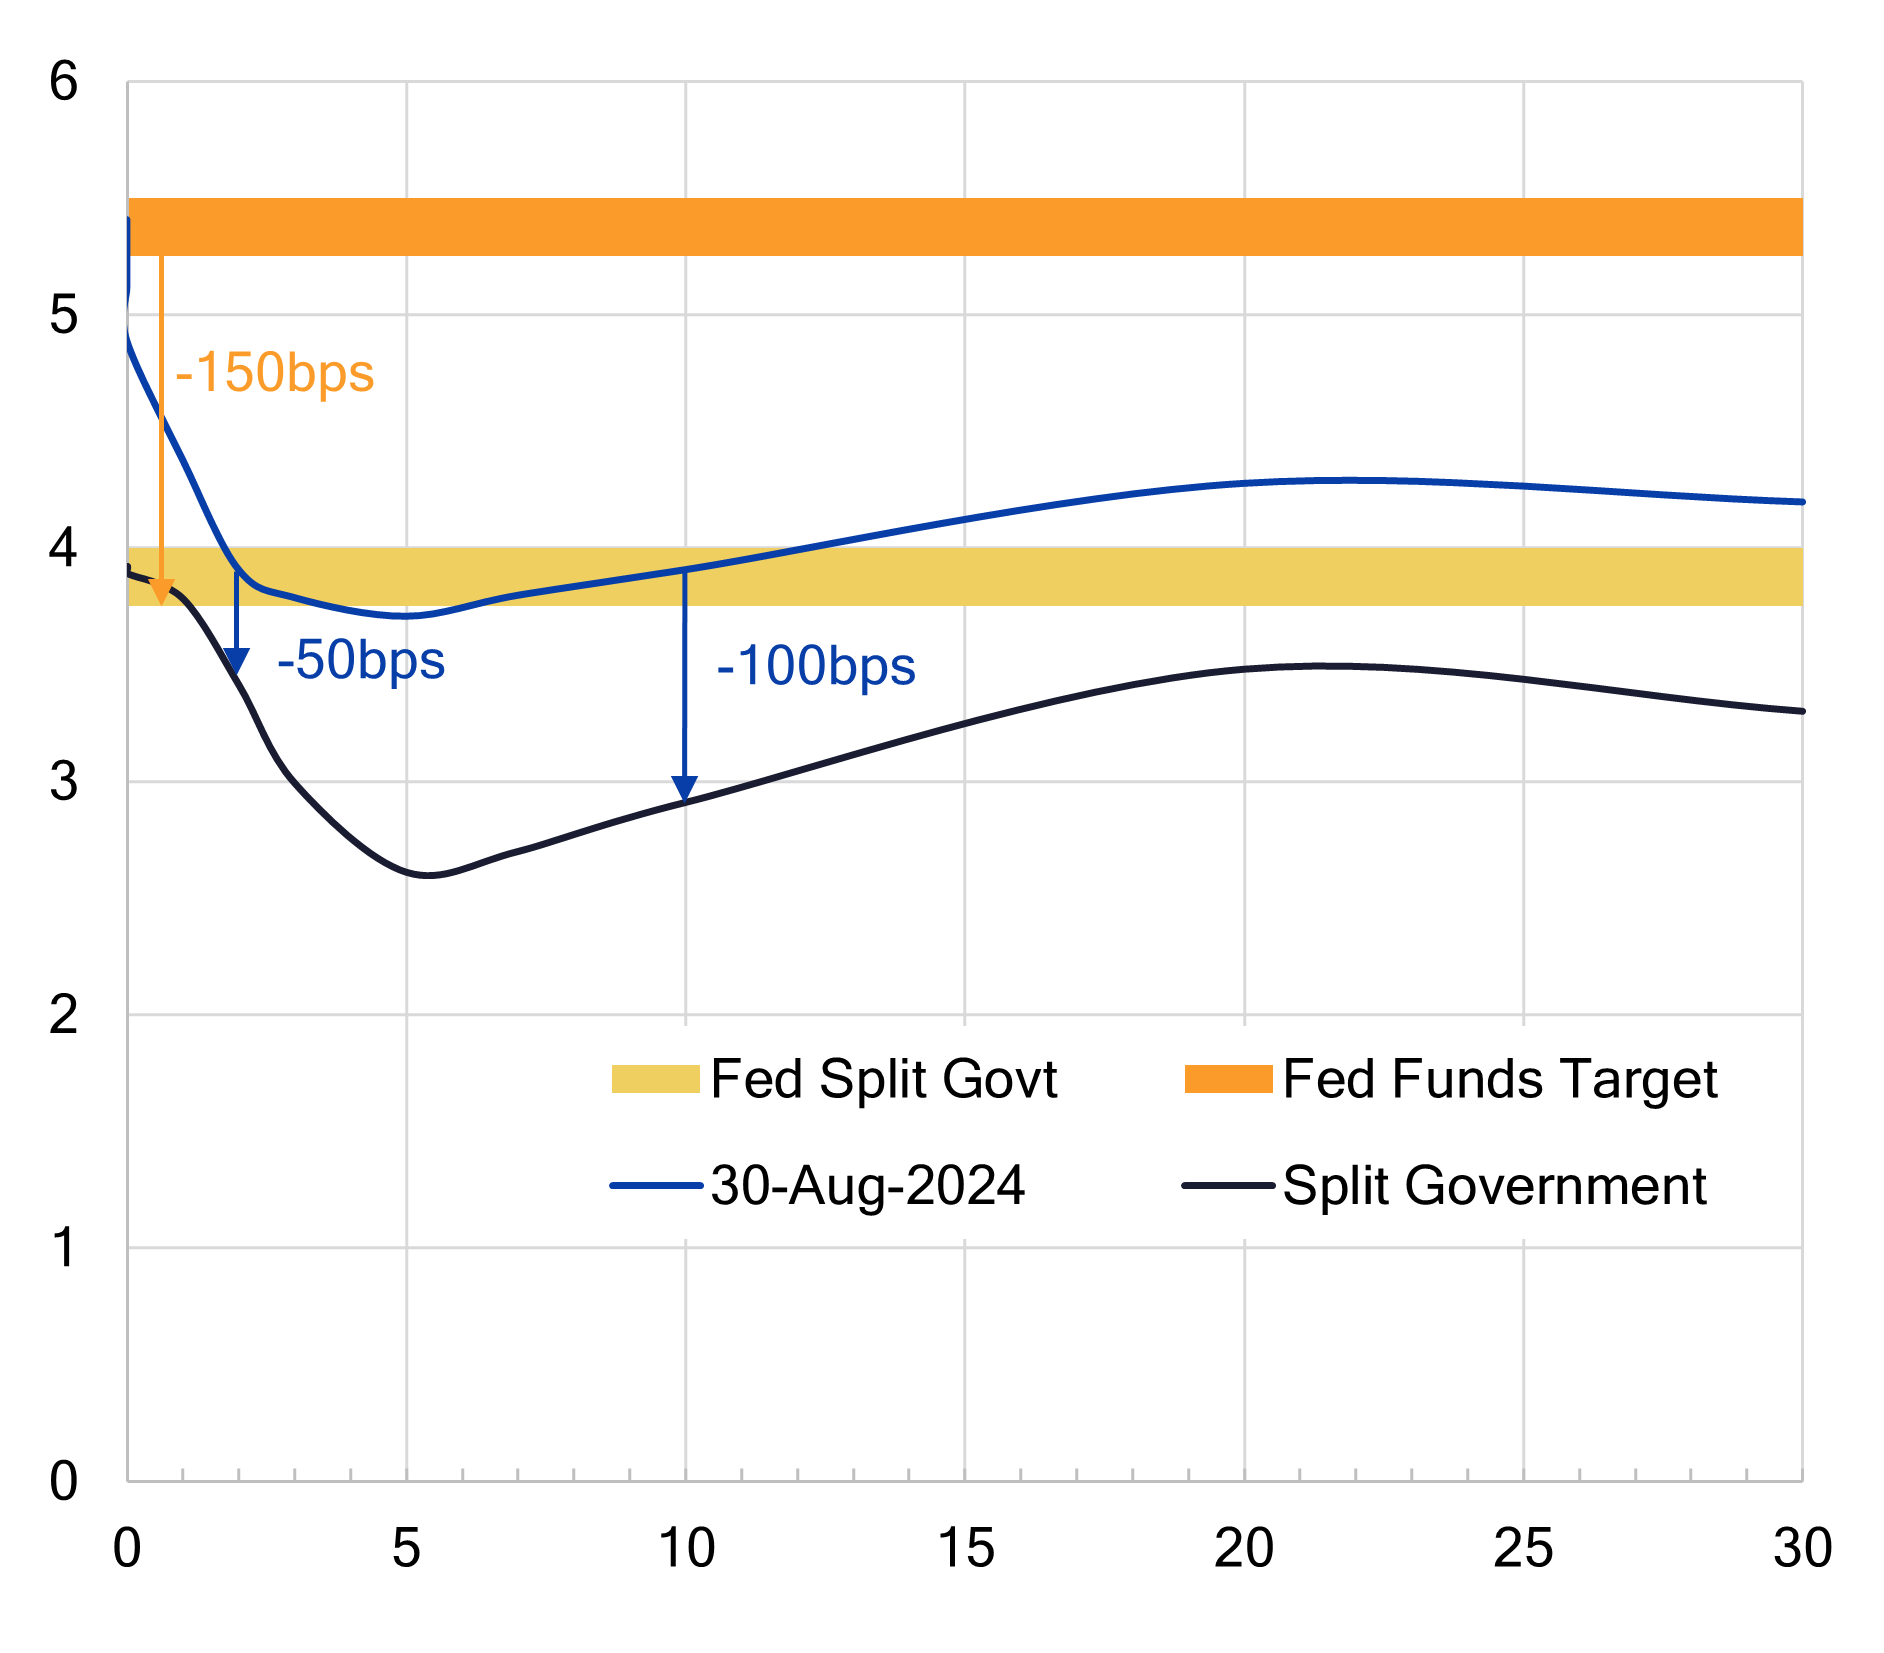
Source: Multi-Asset Class Risk Monitor Insights, Christoph Schon, September 12, 2024
After determining the direction and magnitude of the shocks for our stress test, the next step is to choose a historical period to calibrate the correlations between our Treasury yield shocks and the equities in our portfolio. For the “Harris” stress test, we used the period from November 3, 2020, to March 12, 2021, reflecting investors’ reactions and rebalancing following the 2020 Biden and Democrat victory in the last Presidential election. For the “Trump” stress test, we selected the period from November 8, 2016, to February 3, 2017, following his unexpected win in the 2016 election. For the “Divided” stress test, we used the period from April 18 to August 8, 2011, which represents the aftermath of the credit rating downgrade of the United States sovereign debt by Standard and Poor’s from AAA to AA+, and includes black Monday 2011.
Running the stress tests
We conducted these stress tests on the S&P 500 index using Axioma Risk to determine the expected losses or gains for each constituent in the benchmark portfolio. The stress tests were performed on the index constituents as of Friday, August 23rd, shortly after the release of the Penn Wharton report. Figure 4 below presents the results for the top 10 weights in the index on that date. The top row displays the expected impact on the index as a whole, while the rows below illustrate the constituent-level impact. The results indicated a considerable variation in outcomes for each constituent across the different scenarios. Based on these results, we create a constituent-level alpha file for each scenario, representing our forecasted returns. These files are then used in the Axioma Portfolio Optimizer software for portfolio construction.
Figure 4: Stress test results for top ten weights in S&P Index as of August 23, 2024
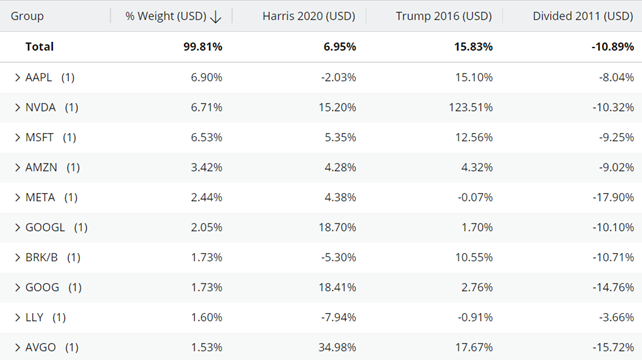
Source: Axioma Risk 2
Creating optimal active portfolios for each scenario
In the next step, we load both the alpha files from our stress test results and the S&P 500 portfolio into the Axioma Portfolio Optimizer. Our current active portfolio has an active risk mandate of 2% and currently maintains an active risk of 1.83%. We aim to create three optimal active portfolios—one for each scenario—with the objective of maximizing return while adhering to our 2% Active Risk budget. Essentially, we seek to construct high-conviction, high-return portfolios for each scenario, focusing on the preferred constituents from our stress test results while ensuring that the ex-ante Active Risk does not exceed 2% relative to the benchmark. This approach will help us determine the additional alpha that can be harvested by accurately forecasting election results (i.e., is it even worth the trouble?).
Figure 5: Active Risk and Return chart comparing optimal portfolios to our current active portfolio
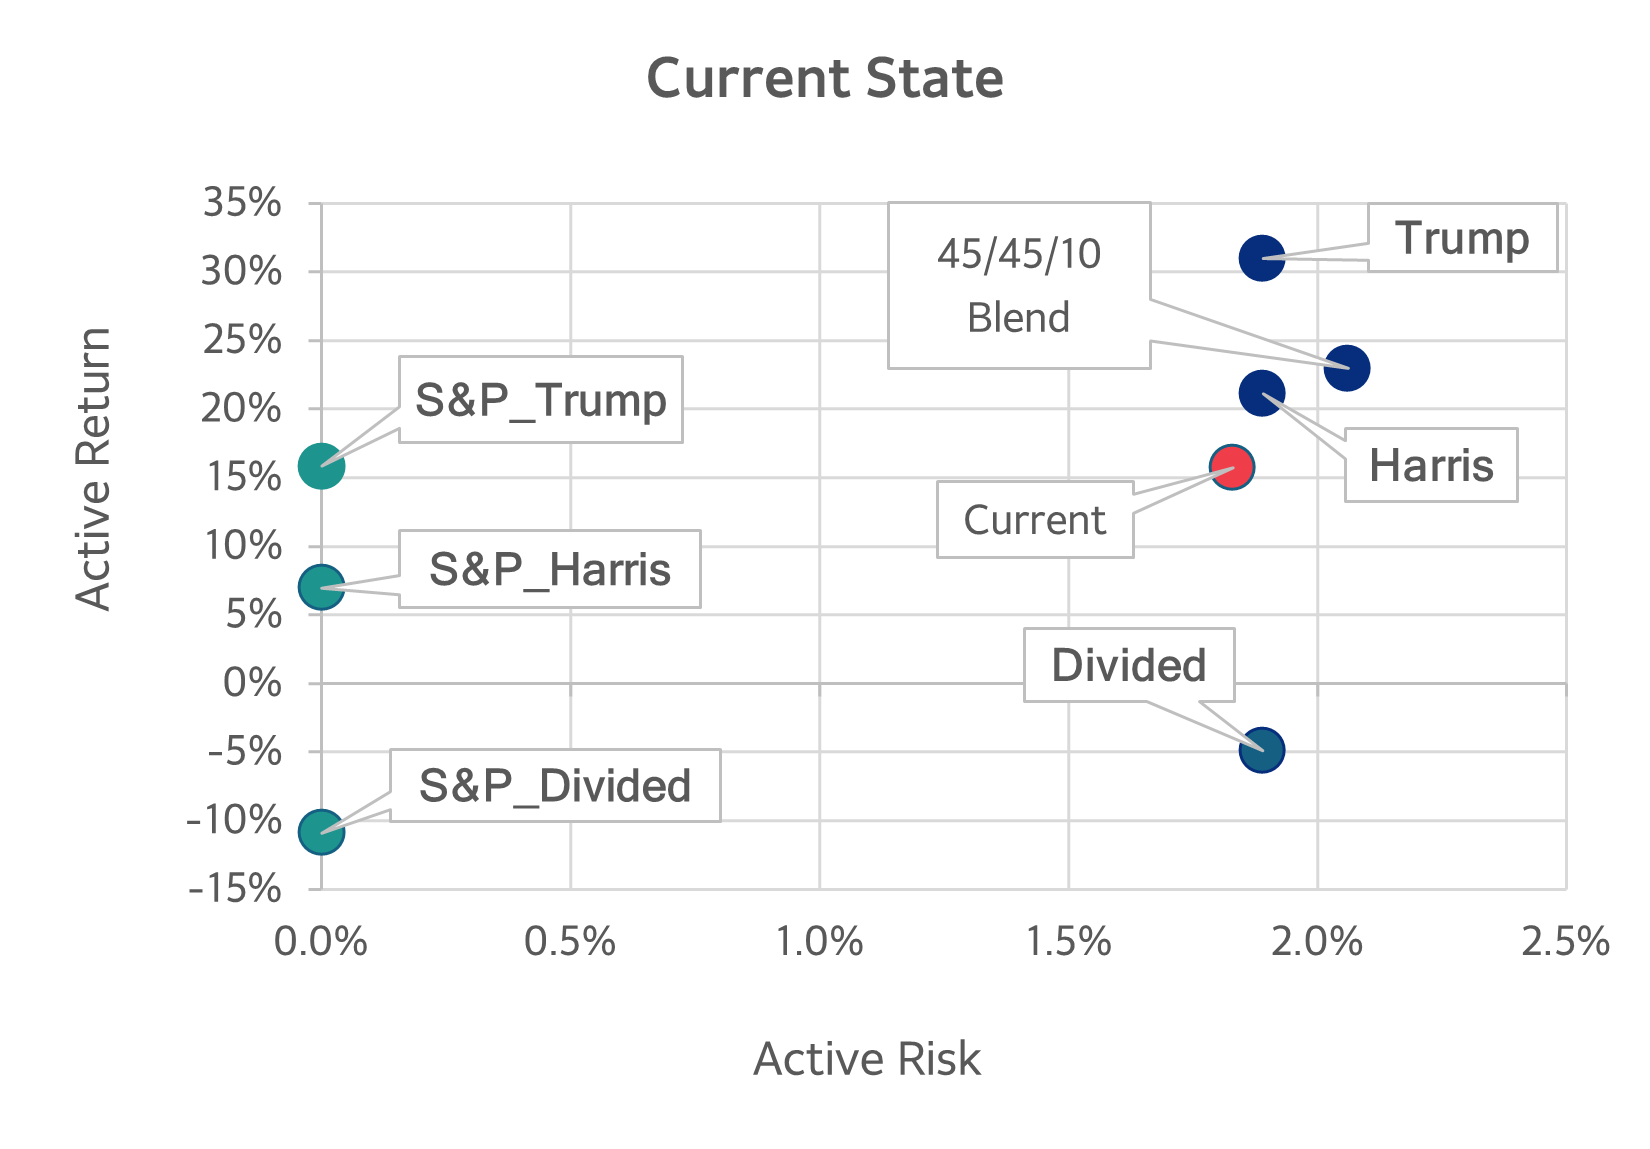
Source: Axioma Portfolio Optimizer
Figure 5 above illustrates where our current portfolio (red) stands in the active risk/return space compared to the three optimal solutions for our election scenarios (navy blue) and the expected returns to the S&P 500 index from our stress tests (green). Our current portfolio is projected to outperform the index by 15.7%, which coincidentally matches the expected active returns of the full index portfolio under the Trump Scenario. However, the optimal active portfolio for a Trump victory could yield a 31% active return, nearly double that of our current portfolio if this was the election result forecast we had in mind.
Similarly, the Harris stress test results show a 7% (6.95%) return for the index, but an optimal portfolio for that scenario could return 21%, almost three times the return of holding the index itself and over 5% more than our current active portfolio (21.1% vs. 15.7%), all for the same amount of active risk. In the case of the Divided scenario, the index is expected to lose about 11% (-10.9%), while an optimal active portfolio for that result could reduce the loss to just 4.9%.
Overall, these results indicate that incorporating an ‘election alpha’ into our investment process could yield significant added returns, provided the election outcome aligns with our expectations.
What is the election result the market seems to be predicting?
To gauge where our investor peers stand regarding our three election scenarios, we imported our three optimal portfolios into the Axioma Performance Analytics platform and ran a daily performance attribution report for the ten days leading up to the first presidential debate (i.e., from August 24th to September 9th). Figure 6 below compares the performance of the three portfolios.
Figure 6: Cumulative returns for optimal portfolios from August 24th through to September 9th
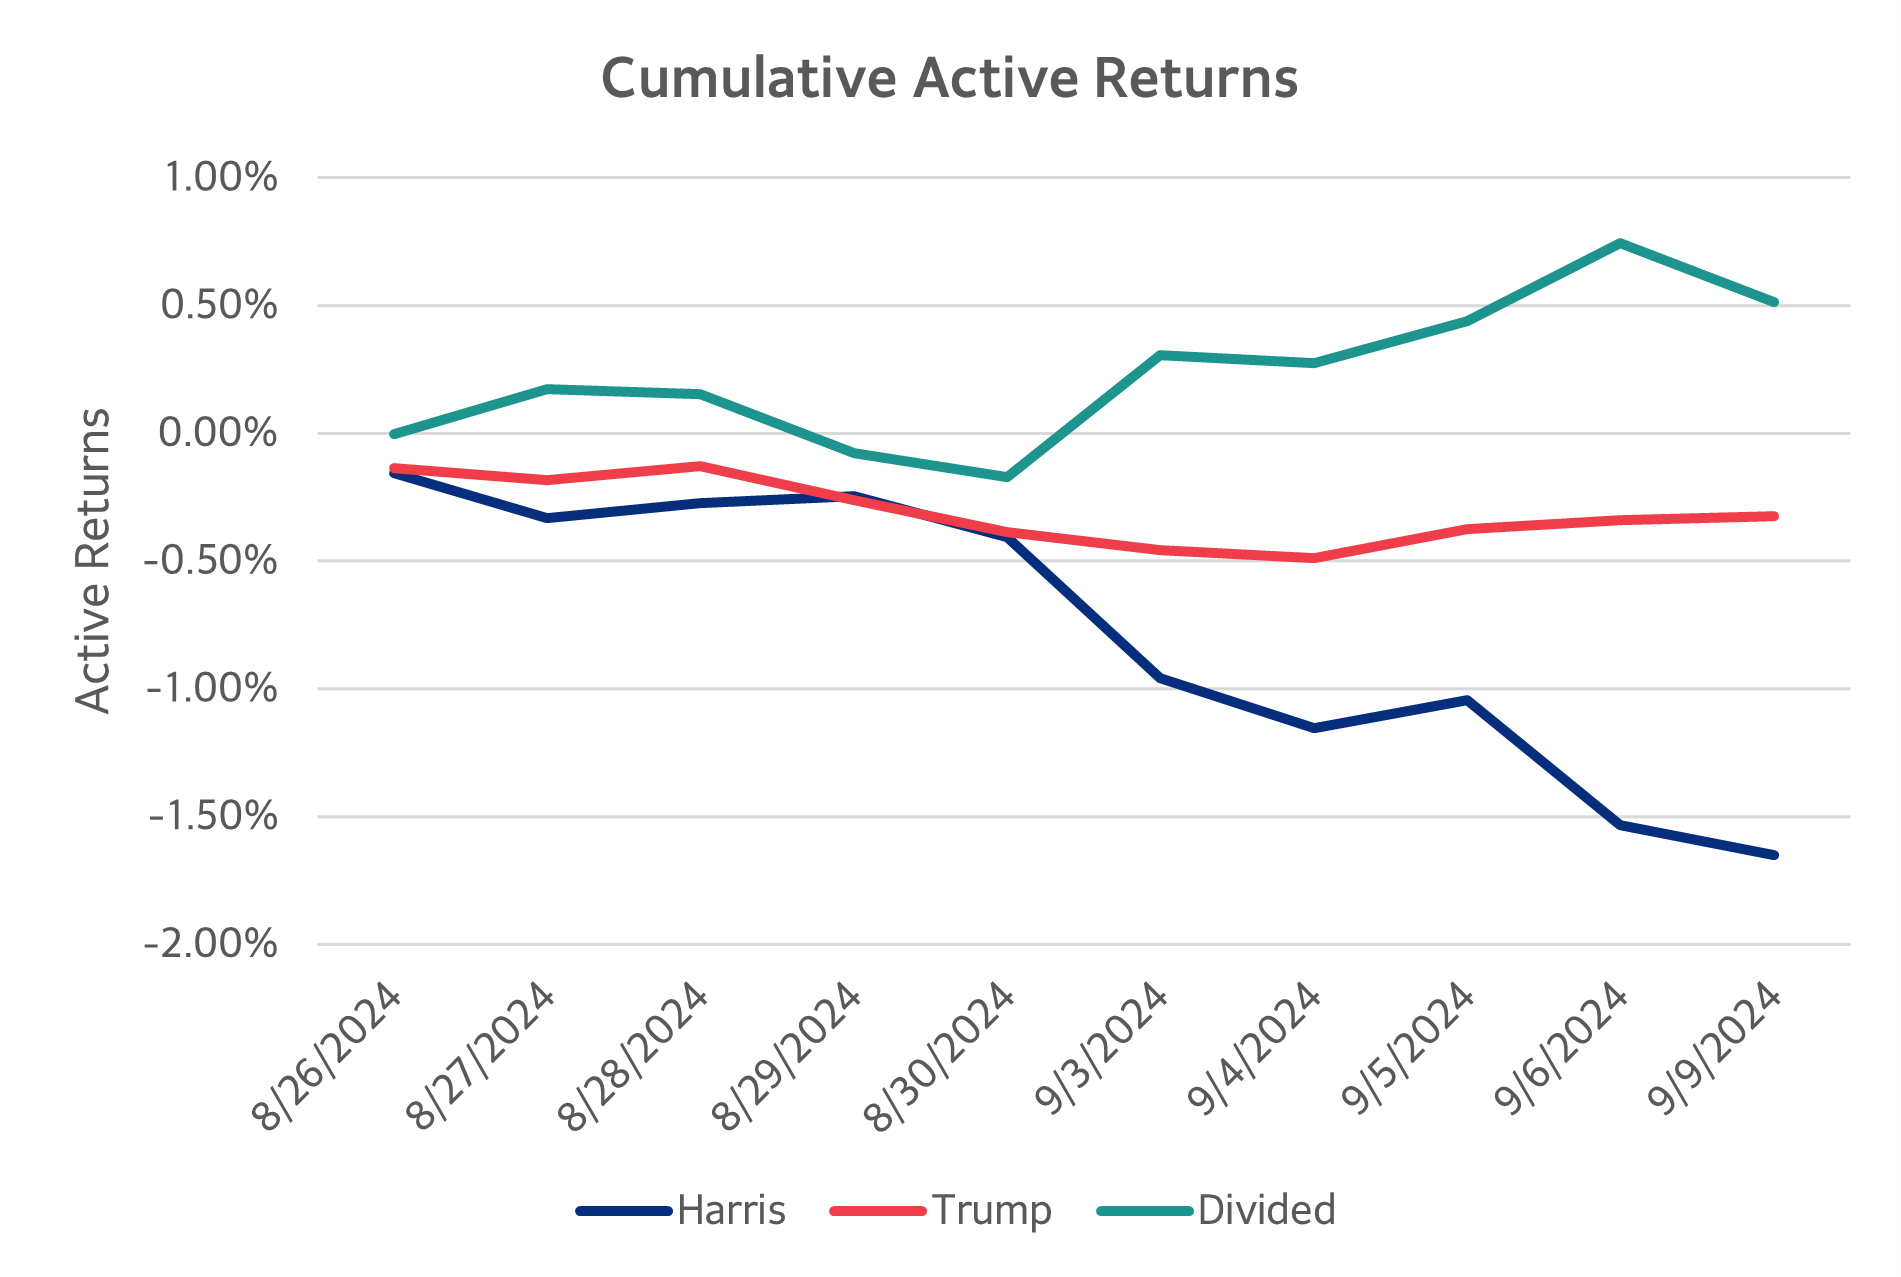
Source: Axioma Portfolio Analytics
Interestingly, until August 30th, none of the three scenarios appeared to be a clear favorite among investors. However, during the first five trading days of September, investors seemed to be leaning towards the ‘Divided’ outcome, with the ‘Harris’ result being the least favored and the ‘Trump’ result given roughly an even chance. For now.
We will run a performance update at the end of September to assess any changes in investor sentiment following the first debate, similar to the shift observed after the Trump-Biden debate in late June. If a clear favorite emerges among investors, we expect one of our three optimal portfolios to outperform the others. Investors holding the ‘Current’ active portfolio may consider rebalancing by configuring a dual benchmark optimization in the Axioma Portfolio Optimizer tool. This involves asking the optimizer to adjust their existing active portfolio to remain within their 2% active risk mandate relative to the S&P 500 benchmark, while also staying within a short distance (e.g., 1% active risk) to the leading election result portfolio. This approach will help minimize turnover and market impact on the day the election results are announced, ensuring they are not far from the optimal solution for that outcome.
Reference
1 From the Market & Investment Risk Insights (MAC) Webinar on September 12,2024. Watch here.
2 Contact us for full graph.